Health benefits have quietly become one of the most expensive parts of employing people. What was once considered a standard employee benefit has gradually evolved into one of the largest recurring costs on an employer’s balance sheet.
According to the 2023 KFF Employer Health Benefits Survey, the average annual premium for employer-sponsored family coverage reached $23,968, with workers contributing about $6,575 and employers covering the remaining share.
Even more striking is the pace of growth; premiums rose 7% in a single year, a jump that outpaced wage growth and many other operating expenses.
At the same time, spending on workplace well-being has expanded rapidly. The corporate wellness market is now estimated to be worth $65 billion globally, and analysts expect steady growth as organizations invest in prevention, mental health support, and broader employee well-being initiatives.
As these costs continue to rise, executives are asking a more pointed question: Is wellness simply a good thing to offer employees, or is it a financially sound investment?
This post walks through what a workplace wellness CBA actually measures, how to build one from scratch, a worked example for a 1,000-person employer, and the most common mistakes that lead organizations to overpromise results or underestimate costs.
Key Takeaways
- Cost-benefit analysis (CBA) is a planning tool. It helps you decide whether to fund a wellness program. ROI is a measurement tool; it evaluates the program after it runs. Run the CBA first.
- Most employers underestimate total program costs by ignoring internal labor, integration work, and employee time — not just the vendor's per-employee fee.
- Measurable benefits fall into three categories: financial (claims, absenteeism), proxy (productivity, presenteeism), and strategic (retention, employer brand). Only the first category belongs as a core line item in a strict CBA.
- High participation rates drive every benefit in the model. The difference between a 20% and 60% participation rate can shift your CBA from negative to strongly positive.
- Build three scenarios — best, base, and worst case — using conservative assumptions from peer-reviewed benchmarks, not vendor promises.
Why Cost–Benefit Analysis Comes Before ROI?
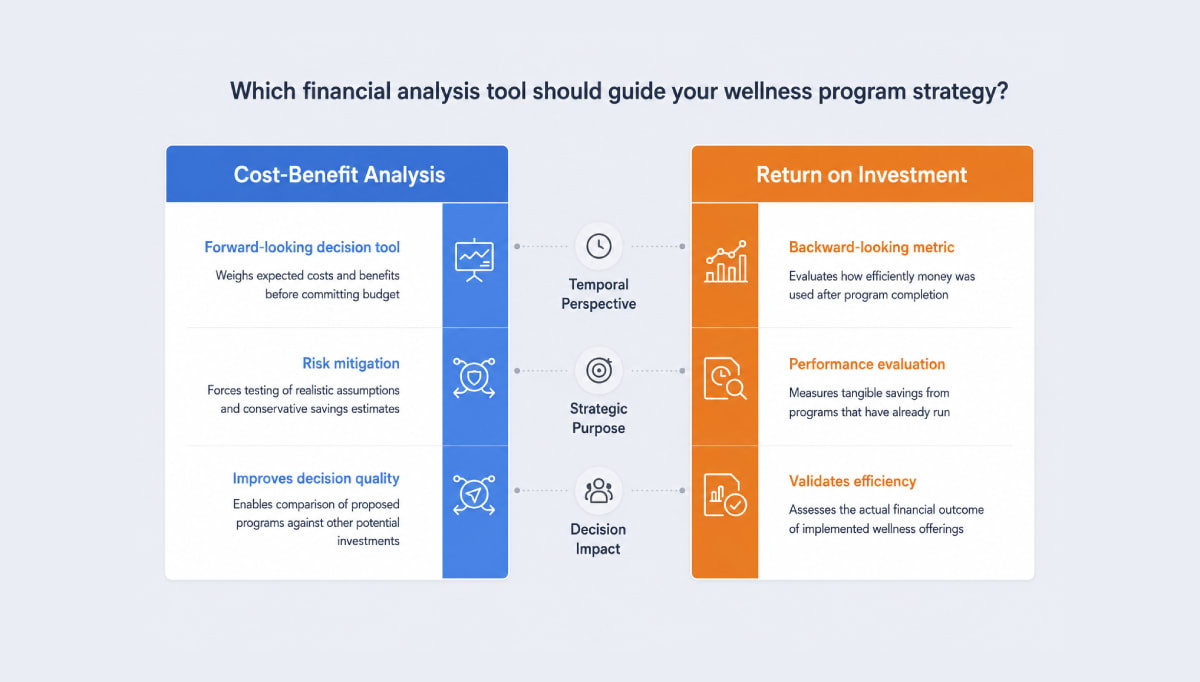
Workplace wellness cost–benefit analysis and ROI are related but not interchangeable.
CBA is a forward‑looking decision tool: it weighs expected costs and benefits, tests scenarios, and compares a proposed wellness program with other possible investments before the organization commits budget.
Corporate wellness ROI, on the other hand, is a backward‑looking metric that evaluates how efficiently money was used after the program has run for some time.
This distinction matters because wellness outcomes are highly sensitive to design and targeting.
A widely cited meta-analysis by Baicker, Cutler, and Song (Health Affairs) found that wellness programs were associated with about $3.27 in lower medical costs and $2.73 in lower absenteeism costs for every dollar spent. Those results, however, reflect specific contexts and relatively structured programs.
Later research, including the RAND Workplace Wellness Programs Study, concluded that broad wellness offerings produced little immediate impact on total healthcare spending for most employers, while focused disease‑management components delivered more tangible savings.
If leaders jump straight to “expected ROI” using best‑case figures from the literature, they tend to overestimate savings and underestimate risk.
A good CBA forces the team to test more realistic assumptions i.e., different participation rates, slower behavior change, conservative savings estimates and to consider the time horizon over which any benefits would appear. That improves decision quality before any money is spent.
What a Cost–Benefit Analysis Actually Measures (And What It Ignores)
A financial CBA looks only at the costs an employer will pay and the financial benefits it can realistically capture. It does not attempt to measure every positive outcome that wellness might create. Being clear about these limits makes the analysis more credible to skeptical stakeholders.
What CBA usually measures
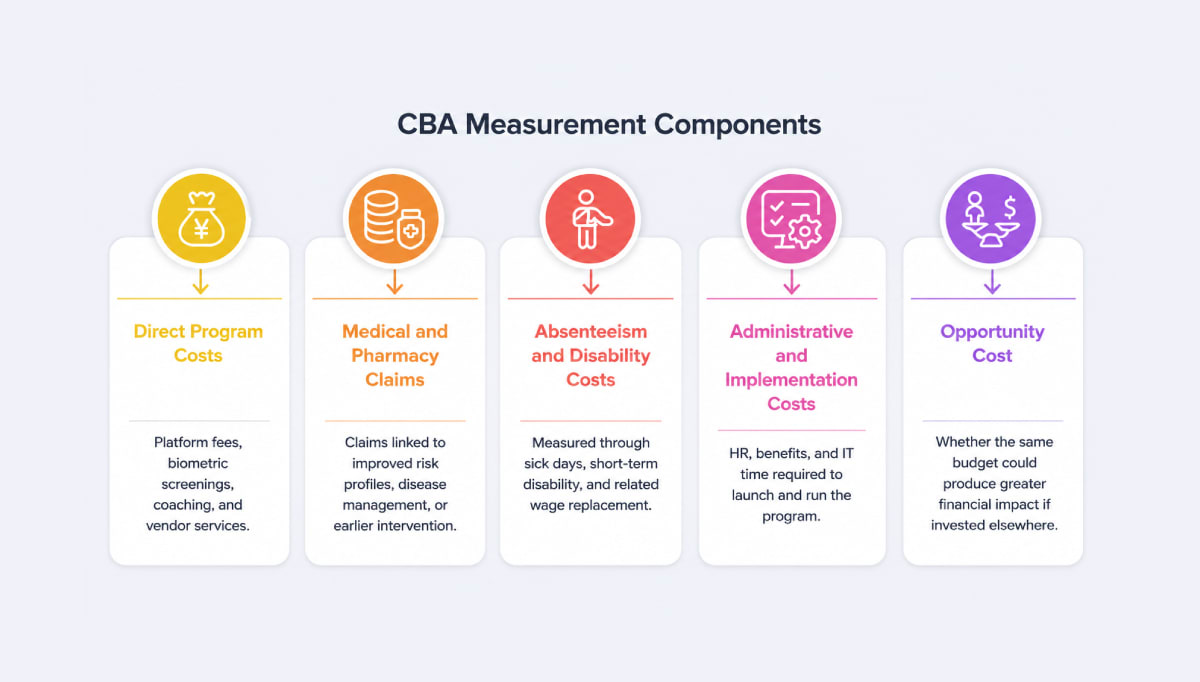
Most employer CBAs concentrate on:
- Direct program costs such as platform fees, biometric screenings, coaching, and vendor services.
- Medical and pharmacy claims that can plausibly be linked to improved risk profiles, disease management, or earlier intervention.
- Absenteeism and disability costs, measured through sick days, short‑term disability, and related wage replacement.
- Administrative and implementation costs like HR, benefits, and IT time required to launch and run the program.
- Opportunity cost—whether the same budget could produce greater financial impact if invested elsewhere, such as automation or headcount in revenue‑generating roles.
These are the elements that can be modeled with reasonable rigor in a financial spreadsheet.
What CBA often ignores or underweights
Because it focuses on the employer’s private financial return, a traditional CBA tends to sideline:
- Cultural and engagement effects - Organizations with a good culture of wellness have been shown to outperform peers on revenue per employee and long‑term shareholder returns.
But it is difficult to isolate how much of that advantage comes from wellness investments versus leadership, pay, or strategy.
- Presenteeism and “unproductive labor - Great Place To Work, citing McKinsey research, notes that the average annual cost to a company of every hour of “unproductive labor” is around $15,000 once you scale it across a workforce.
Wellness programs that improve focus, energy, and mental health may influence this, but the connection is rarely captured cleanly in financial models.
- Long‑term prevention benefits - Lifestyle programs aim to delay or avoid chronic conditions, but savings from preventing a future heart attack or case of diabetes may only materialize years down the line, sometimes beyond the measurement window used in an ROI study.
Important: Acknowledge what CBA cannot measure rather than stretching the model to "prove" benefits it cannot quantify reliably. Overpromising erodes credibility with finance stakeholders.
Once the scope is defined, the next step is to map the full cost structure of a wellness program; something many organizations underestimate when they focus only on vendor pricing.
The Cost Side: Where Employers Usually Underestimate Spending
When employers think about wellness costs, many start and stop with the vendor’s per‑employee price. In reality, total program costs have several layers. Underestimating them upfront is one of the most common CBA mistakes.
1. Direct external costs
These are the items that appear in contracts and invoices:
- Platform and service fees. Corporate wellness solutions are often priced per employee per month, with reported ranges that translate to roughly $150–$400 per eligible employee per year for basic programs, and higher for more intensive or high‑touch offerings.
- Biometric screenings and assessments. On‑site biometric screening events, including tests such as cholesterol, blood pressure, and glucose, are commonly priced in the tens of dollars per participant, with many vendors quoting around $45–$70 per person depending on the panel and volume.
- Coaching, workshops, and specialty programs. Stress‑management workshops, nutrition counseling, and one‑to‑one coaching add to the per‑employee cost, especially if delivered by clinical professionals.
2. Incentives and rewards
Incentives are often the largest variable cost driver. Employer surveys have found that many companies now budget a few hundred dollars per employee per year for wellness incentives, whether in the form of gift cards, cash, merchandise, or health savings account contributions.
Benefits‑based incentives such as premium discounts can be more generous but also more expensive if uptake is high.
A realistic CBA should model incentive costs under different participation scenarios rather than assuming a flat “per employee” figure that ignores who actually engages.
3. Internal labor and communication
Internal time rarely appears in wellness vendor proposals, but it is real spend. HR and benefits teams must design policies, coordinate with vendors, administer incentives, manage communications, and answer employee questions.
IT teams support integrations and troubleshoot access issues. Line managers spend time promoting and normalizing participation.
These hours can be approximated and monetized using internal hourly cost estimates, then added to the cost side of the analysis to avoid undercounting.
4. Integration and data costs
Connecting wellness platforms to HRIS systems, single sign‑on, payroll, claims feeds, or analytics tools often requires projects that span several weeks or months. In addition to one‑time integration work, there are ongoing costs to maintain data pipelines, update APIs, and ensure privacy and security compliance.
For organizations that want robust reporting, these costs should be explicitly scoped and budgeted.
5. Opportunity cost of employee time
Finally, employees may participate during working hours—completing health assessments, joining webinars, or taking part in fitness or mindfulness activities. Even if this time allocation is intentional and desirable, it is a cost.
Some employers estimate it by multiplying program activity hours by average hourly compensation to understand the implicit investment they are making.
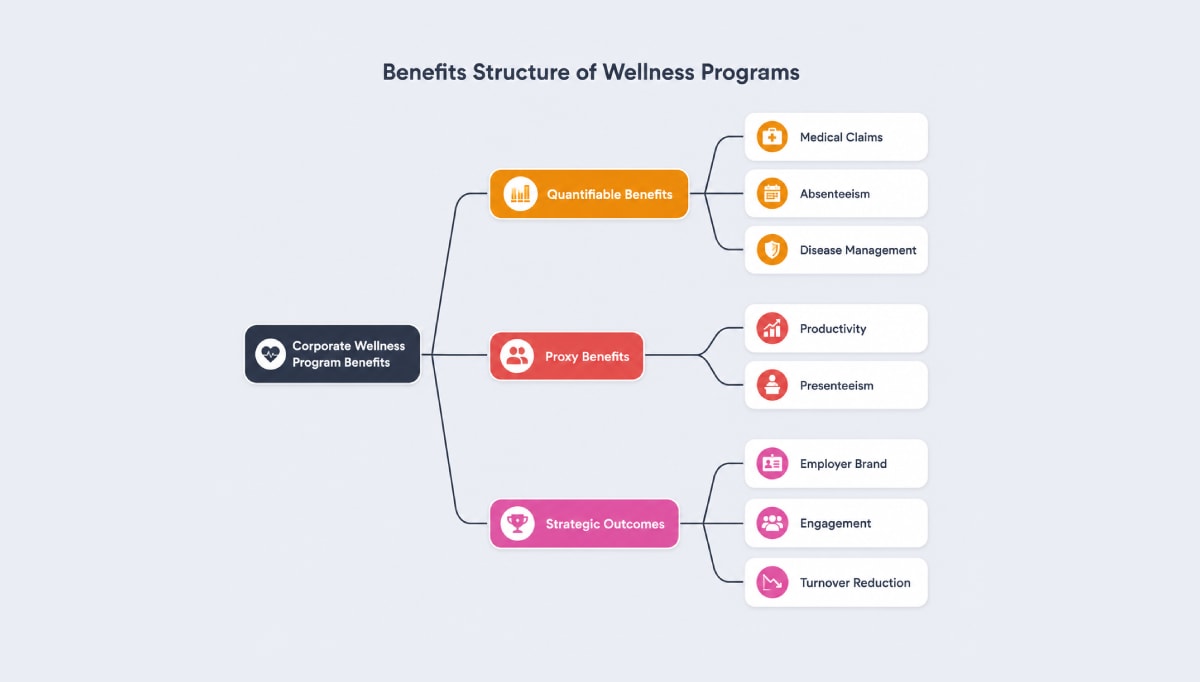
Once the full cost structure is clear, the next question is what employers can reasonably expect in return. The benefit side of a wellness CBA typically includes three categories: measurable financial savings, proxy productivity gains, and broader strategic outcomes.
The Benefit Side: What Can Be Quantified vs. What Is Often Assumed
On the benefit side, discipline matters just as much as on the cost side. The most persuasive CBAs are careful about which benefits are treated as measurable, which are treated as proxies, and which are acknowledged as strategic upsides that support (but do not solely justify) the investment.
1. Quantifiable and semi‑quantifiable benefits
These elements can usually be tied to financials with reasonable confidence:
- Medical and pharmacy claims- The Baicker, Cutler, and Song meta‑analysis concluded that, across a set of employer programs, medical costs fell by about $3.27 for every dollar spent on wellness. Employers actively working to reduce healthcare costs often cite claims reduction as the clearest financial lever.
Later work has found more mixed results, but claims data remain the primary financial lens for health‑plan sponsors.
- Absenteeism- The same analysis also found meaningful reductions in absence-related costs, averaging roughly $2.73 saved for every dollar invested.
Other studies have shown that employees who meet physical‑activity guidelines have significantly lower rates of unplanned illness‑related absence than inactive peers, reinforcing absenteeism as a reasonable benefit metric.
- Targeted disease‑management savings- RAND’s work on a large employer’s wellness program found that the combination of lifestyle and disease‑management support reduced healthcare costs by about $30 per member per month, but 87% of those savings came from disease management components offered to employees with chronic conditions.
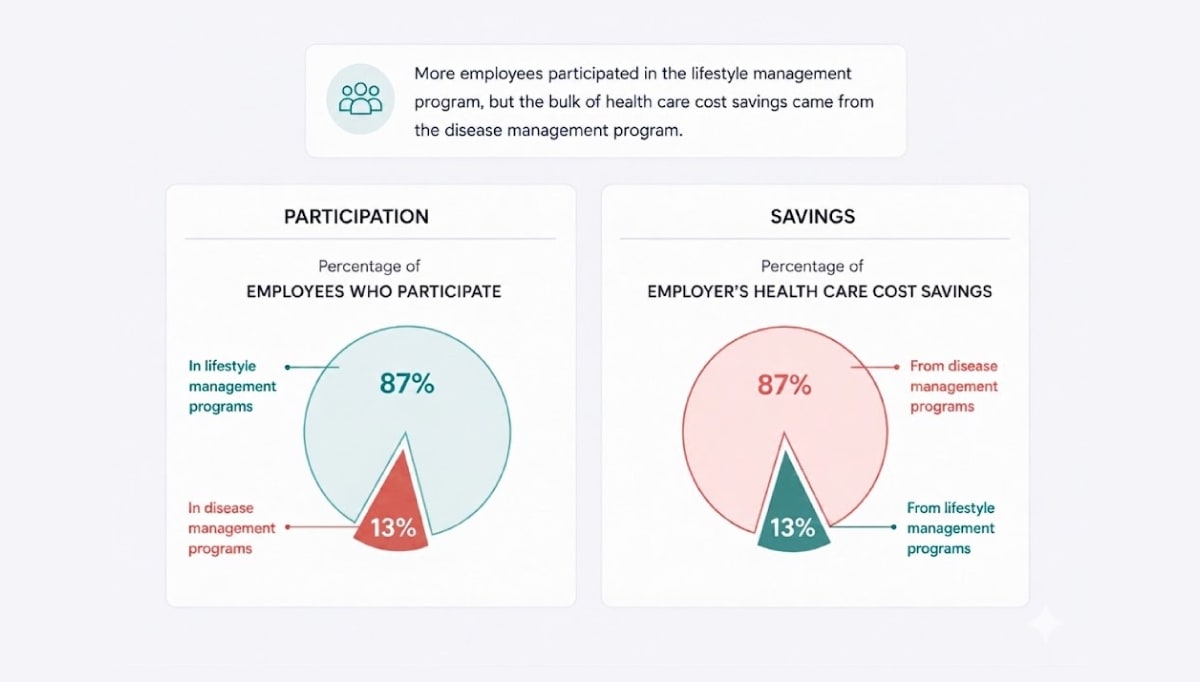
When measured separately, disease management delivered around $136 in monthly savings per participant and roughly a $3.80 return for every dollar spent, while broad lifestyle programs produced an ROI of only about $0.50 per dollar.
In a CBA, these figures can be used as reference points (and not guarantees) to shape conservative assumptions about potential claims and absenteeism improvements, adjusted for each employer’s baseline.
2. Proxy benefits: productivity and presenteeism
Many of the benefits employers care most about sit in the “gray zone” between hard and soft outcomes. These include:
- Ability to focus and sustain attention.
- Energy levels and fatigue.
- Stress, anxiety, and burnout.
- Team climate and collaboration.
Researchers often use self‑reported health surveys, validated presenteeism scales, or engagement measures as proxies for these outcomes, then estimate their economic effect by linking them to revenue per employee or value‑of‑time models.
Great Place To Work, citing McKinsey research, estimates that unproductive labor costs the average company roughly $15,000 per employee annually when accounting for lost focus, presenteeism, and disengagement.
Speaking on the impact of workplace wellness programs, our Podcast guest Deepshika Bhowmick shared:
"When you're in good health, it reduces absenteeism, reduces presenteeism — being physically present but not fully productive — and reduces turnover. People are 20% more likely to work and stay in an organisation with a well-established employee wellness program."
For CBA, it is reasonable to:
- Track changes in self‑reported health, stress, or focus among program participants.
- Apply conservative productivity multipliers (for example, a small percentage improvement) to an estimated value of labor for those groups.
- Present these as scenario‑based estimates rather than as guaranteed “savings.”
3. Difficult‑to‑measure strategic outcomes
Some outcomes are genuinely strategic, even if they are hard to quantify rigorously:
- Enhanced employer brand and candidate appeal, especially among younger workers who prioritize well‑being and mental‑health support — a key reason why the benefits of employee wellness programs extend well beyond cost savings.
- Stronger engagement and discretionary effort, which have been linked to outperformance on productivity and profitability metrics.
- Reduced unwanted turnover and associated hiring and onboarding costs.
For example, McKinsey estimates that disengagement and attrition can cost a median‑size S&P 500 company hundreds of millions of dollars per year in lost productivity.
While wellness is only one variable among many that influence engagement and retention, it is an increasingly visible part of the employee value proposition.
In a strict financial CBA, these outcomes are best treated as “strategic upside” that strengthens the narrative around wellness investments rather than as core, precisely quantified line items.
How to Run a Cost–Benefit Analysis for a Wellness Program
A practical CBA does not need to be perfect. It needs to be structured, transparent, and grounded in realistic assumptions.
1. Clarify the goal and scope
Decide whether you are primarily trying to curb specific medical‑cost drivers, reduce absence, support mental health, improve retention, or a combination of these. Define which elements of your wellness strategy are in scope for the analysis—for example, lifestyle programs only, or lifestyle plus disease management and EAP.
2. Build a complete cost map
List all vendor fees, incentives, biometric and assessment costs, implementation expenses, internal labor, and expected employee time spent on wellness activities. Use actual quotes where possible, and reference market ranges where you have to estimate.
3. Establish baselines
Collect at least three years of historic data on:
- Per‑employee medical and pharmacy spend.
- Absenteeism and, if possible, short‑term disability.
- Engagement, stress, and voluntary turnover.
Identify the conditions and risk factors (such as diabetes, hypertension, or burnout) that are driving a disproportionate share of costs.
4. Choose cautious effect sizes
Use external research as a guide rather than a promise. For example:
- Use Baicker et al.’s $3.27 and $2.73 per dollar figures as an upper bound, and model your base case lower.
- Use RAND’s disease‑management ROI (around $3.80 per dollar) to justify investment in targeted chronic‑condition support, but assume much smaller near‑term savings from broad lifestyle campaigns.
Build best‑, base‑, and worst‑case scenarios around these parameters.
5. Reflect time horizons
Model when you expect different benefits to show up. Claims reductions from improved chronic‑disease management may appear within one to two years, while risk‑factor improvements from lifestyle coaching may take several years to affect heavy‑cost events like hospitalizations. Be explicit about how long you are giving programs to prove themselves.
6. Compare wellness to other options
Treat wellness as one potential investment among many. Compare its modeled net present value or payback period to alternatives such as automation projects, sales enablement, or manager training. This speaks directly to CFO concerns about capital allocation.
7. Plan for measurement and course correction
Decide how you will track participation, risk changes, claims, absence, and relevant survey scores from the outset. Commit to refreshing the CBA at set intervals, retiring underperforming elements, and doubling down where the data shows clear value.
Worked Example: Cost–Benefit Analysis of a Wellness Program
To make the concept more concrete, consider a mid-size employer with 1,000 employees implementing a basic wellness program that includes:
- wellness platform access
- biometric screenings
- lifestyle challenges
- targeted disease-management coaching
Below is a simplified cost–benefit model using conservative assumptions drawn from published research and industry benchmarks.
Step 1: Program Costs
Vendor platform
$10 per employee per month
Biometric screening
Participation: 60% · Cost per screening: $60
Wellness incentives
$200 per participating employee · Participation: 60%
Administration and internal labor
HR + IT + communication time estimated at $50,000 annually.
Total Annual Program Cost
| Cost component | Amount |
|---|---|
| Platform | $120,000 |
| Biometric screenings | $36,000 |
| Incentives | $120,000 |
| Administration | $50,000 |
| Total | $326,000 |
Step 2: Estimate Quantifiable Benefits
1. Medical claims savings
Assume $9,000 per employee per year on healthcare — total baseline spend of $9,000,000. If targeted disease-management and prevention reduce claims by 2%:
(Conservative compared with higher estimates reported in some studies.)
2. Absenteeism reduction
Average absenteeism cost ≈ $2,650 per employee annually — total baseline of $2,650,000. If wellness reduces absence by 5%:
Studies consistently link wellness programs with lower absence rates.
3. Productivity improvement (conservative proxy)
Assume only 1% productivity improvement among the 600 participating employees at an average salary of $70,000:
Productivity improvements often represent the largest hidden value of wellness initiatives.
Step 3: Total Estimated Benefits
| Benefit source | Annual value |
|---|---|
| Medical claims reduction | $180,000 |
| Absenteeism reduction | $132,500 |
| Productivity improvement | $420,000 |
| Total | $732,500 |
Step 4: Net Financial Impact
| Metric | Value |
|---|---|
| Total program cost | $326,000 |
| Total estimated benefits | $732,500 |
| Net benefit | $406,500 |
Step 5: ROI
($732,500 − $326,000) ÷ $326,000 = 1.25 (125%)
For every $1 invested, the employer receives about $2.25 in total value.
This result is within the range reported in several studies of workplace wellness programs, although outcomes vary significantly depending on participation rates and program design.
Cost–Benefit Analysis vs ROI: Where Employers Commonly Get It Wrong
Even when organizations attempt a structured analysis, there are recurring pitfalls that skew expectations.
1. Confusing participation with impact
It is tempting to treat high enrollment in lifestyle challenges or app‑based programs as proof of value. RAND’s work, however, shows that lifestyle components with very high participation can still deliver weak or even negative short‑term ROI, while low‑enrollment disease‑management programs generate most of the measurable savings.
CBA should focus on impact per participant and total dollars saved, not just participation rates. That said, participation is a prerequisite for impact.
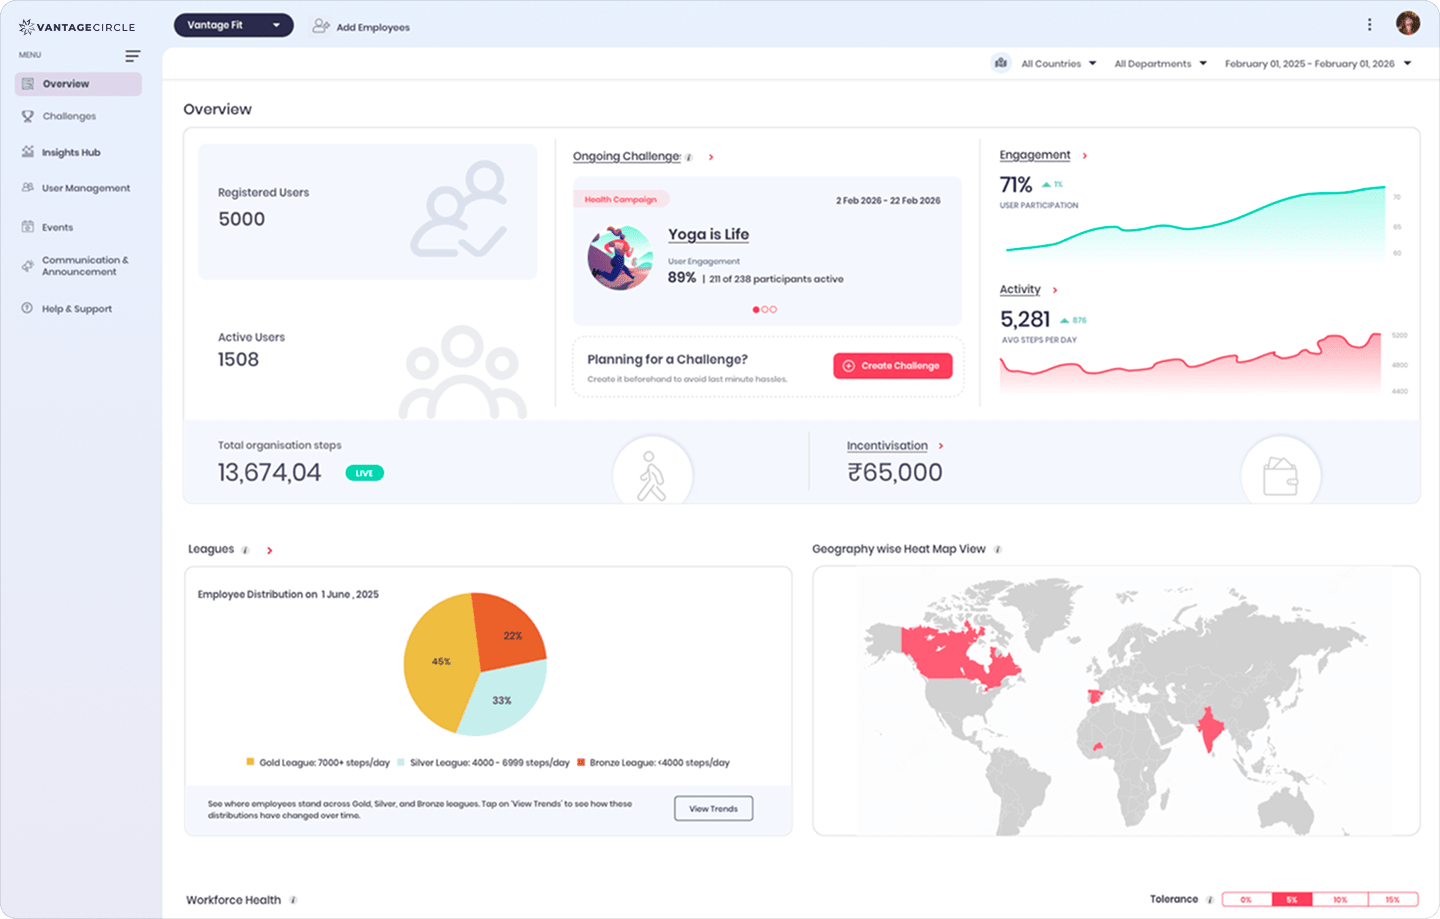
Organisations using Vantage Fit such as Tata Motors' 59% engagement or IBS Software's 88% engagement, are better positioned to realize the benefit side of their CBA.
2. Ignoring the timing of benefits
Lifestyle risk‑reduction is a long‑term play, while disease management often pays off sooner. When CBAs assume that lifestyle programs will immediately cut claims, they oversell benefits and set themselves up for disappointing ROI reviews.
3. Omitting presenteeism and productivity
Many ROI studies track only sick days and medical costs, leaving out productivity effects that might be two to three times larger than direct health‑care savings.
While these are harder to measure, ignoring them altogether underestimates the potential upside of well‑designed mental‑health and resilience initiatives.
4. Treating cost shifting as “savings”
Adjusting plan design or imposing penalties on high‑risk employees can reduce what the employer pays, but may simply move costs onto employees rather than reducing total healthcare utilization.
A sound CBA distinguishes between lower employer subsidies and true efficiency gains.
Above all, ROI is best used after the fact to evaluate performance. CBA is the tool for deciding what to fund in the first place. Keeping those roles separate helps avoid both inflated promises and blanket cynicism about wellness.
Final Thoughts
Cost–benefit analysis will not answer every question about wellness, but it does anchor the conversation in economic reality. It clarifies what you are paying, what you can reasonably expect to get back, over what timeframe, and how that compares to other choices you could make with the same money.
For HR and total‑rewards leaders, leaning into CBA is not about reducing wellness to a spreadsheet. It is about speaking the language of finance while still acknowledging the broader cultural and human stakes. When that happens, wellness programs are much more likely to be designed for the right populations, funded at sustainable levels, and given a fair window to prove their worth.
Most CBA frameworks fall apart not at the planning stage but at the follow-through. The numbers get run once, filed away, and rarely revisited; which means programs that are quietly underperforming never get course-corrected, and ones that are working don't get the expanded investment they deserve.
A platform like Vantage Fit closes that loop: the engagement rates, challenge completion data, and health trend indicators it surfaces give HR teams something concrete to bring back to the table each review cycle, turning the CBA from a one-time document into a living decision tool.
Share